

In the high-stakes world of cryptocurrency, where speculation often overshadows fundamental analysis, a powerful edge awaits those willing to look beyond price charts: on-chain metrics. These invaluable data points, directly verifiable on public blockchains, offer an unparalleled window into the true health, adoption, and sentiment surrounding digital assets. As a financial journalist specializing in emerging markets, I’ve seen firsthand how raw, verifiable data can cut through the noise, and in crypto, on-chain metrics are precisely that.
📋 Table of Contents
While traditional finance relies on earnings reports and economic indicators, crypto investors have a unique opportunity to peer directly into the ledger, observing every transaction, every wallet movement, and every interaction with smart contracts. This granular transparency provides a robust foundation for crypto market analysis, helping you decipher whether a project is genuinely gaining traction or merely riding a wave of speculative fervor. Ignoring this wealth of information is akin to trading stocks without ever looking at a company’s balance sheet.
Diving Deep: Core On-Chain Metrics Every Investor Should Track
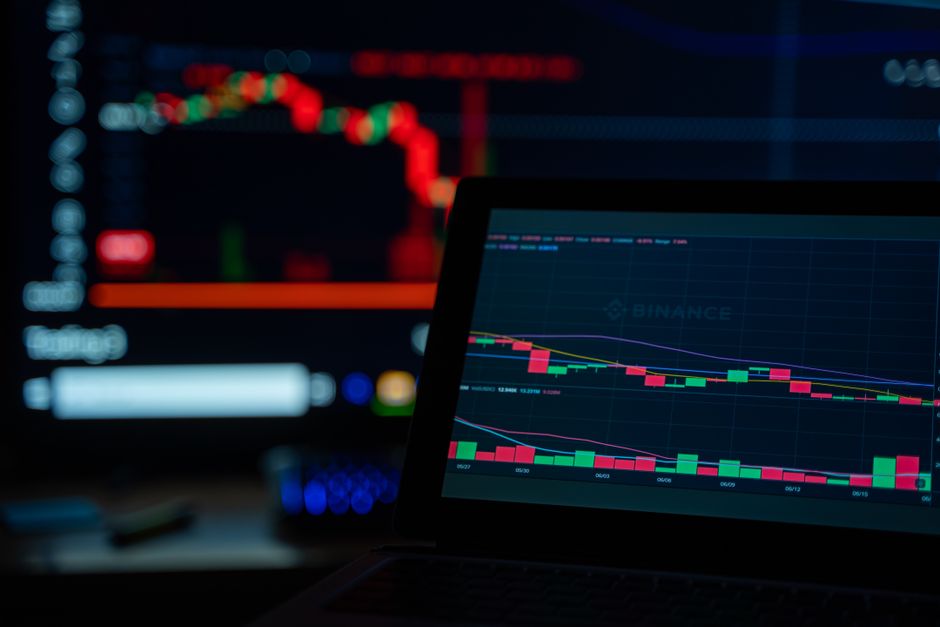
To truly understand the pulse of a blockchain network, you need to go beyond simple price action. These foundational on-chain metrics provide a clear picture of user engagement and network utility, which are critical drivers of long-term value.
Active Addresses & Network Activity
One of the most straightforward yet potent indicators is the number of active addresses. This metric represents the unique number of sending and receiving addresses participating in transactions over a given period, typically 24 hours. A rising number of active addresses suggests growing adoption and utility, indicating real demand for the network’s services. Conversely, a declining trend can signal waning interest or a lack of new users.
For instance, during Bitcoin’s bull run in late 2020 and early 2021, daily active addresses soared from under 800,000 to over 1.2 million, mirroring the surge in price and broader adoption. Ethereum also saw its active addresses consistently above 500,000 during periods of high DeFi and NFT activity, showcasing robust network utility.
Coupled with active addresses, monitoring transaction count and transaction volume provides further insight into network activity. Transaction count tells you how many transactions are occurring, while transaction volume reveals the total value being moved. A healthy network shows consistent or increasing trends across all three, suggesting genuine usage rather than just speculative holding.
Exchange Flows and Investor Sentiment
Understanding where capital is moving – specifically to and from centralized exchanges – can offer significant clues about market direction and investor sentiment. These exchange flows are a cornerstone of on-chain analysis.
- Exchange Inflows: When a significant amount of cryptocurrency moves onto exchanges, it often signals an intent to sell. Investors typically move their assets to exchanges when they want to trade them for fiat or other cryptocurrencies. A large spike in inflows can precede a price correction as selling pressure mounts.
- Exchange Outflows: Conversely, large outflows from exchanges indicate that investors are moving their assets into personal wallets, often for long-term holding or staking. This is generally interpreted as a bullish sign, reducing the immediate selling pressure on exchanges and suggesting accumulation.
We saw a notable example of this in mid-2021, where sustained Bitcoin outflows from exchanges signaled accumulation by institutional and long-term holders, preceding a significant price recovery later in the year. Tracking these movements gives you an early warning system for potential shifts in supply and demand dynamics.
Gauging Market Health Through On-Chain Metrics
Beyond basic activity, certain on-chain indicators provide a more nuanced view of market cycles and potential turning points. These metrics often leverage the concept of realized price or cost basis to assess whether the market is overheated or oversold.
MVRV Ratio (Market Value to Realized Value)
The MVRV Ratio is a particularly insightful metric that compares the current market capitalization (Market Value) of a cryptocurrency to its realized capitalization (Realized Value). Realized Value calculates the value of all coins at the price they last moved on-chain. Essentially, it approximates the average cost basis of all investors.
- MVRV > 1: The market value is higher than the realized value, meaning the average investor is in profit.
- MVRV < 1: The market value is lower than the realized value, meaning the average investor is at a loss.
Historically, an MVRV ratio significantly above 3.0 has often indicated market tops (e.g., Bitcoin in 2017 and early 2021), suggesting that many investors are sitting on substantial profits and might soon sell. Conversely, an MVRV ratio below 1.0 (or even approaching 0.8) has historically marked market bottoms, indicating widespread capitulation and potential for recovery. (See also: Crypto Microstate Citizenship: A Utopia or Pipe Dream for the Ultra-Rich? | AlkaFlow)
Stablecoin Supply Ratio (SSR)
The Stablecoin Supply Ratio (SSR) compares the market cap of Bitcoin (or another crypto) to the total market cap of stablecoins. It helps gauge the potential buying power waiting on the sidelines within the crypto ecosystem. When the SSR is low, it means there’s a relatively high amount of stablecoins compared to Bitcoin’s market cap, indicating significant potential dry powder for buying.
A falling SSR suggests that more stablecoins are available relative to Bitcoin’s value, implying greater potential for buying pressure. Conversely, a rising SSR means stablecoins are being converted into other assets or leaving the ecosystem, potentially signaling a reduction in immediate buying power.
Beyond the Basics: Advanced On-Chain Insights and Practical Application
While the previous metrics provide a solid foundation, more advanced insights can be gleaned from analyzing specific investor cohorts and their behavior. Integrating these into your overall strategy can significantly enhance your understanding.
Long-Term Holder (LTH) Behavior and Dormancy
Tracking the behavior of Long-Term Holders (LTHs), typically defined as addresses holding coins for at least 155 days, is crucial. These investors are often considered the ‘smart money’ and their accumulation or distribution patterns can signal market cycles. When LTHs accumulate, it implies strong conviction and a belief in future price appreciation. When they begin to distribute (sell), it can signal a potential market top.
Coin Dormancy measures the average number of blocks that coins have been held or unmoved. A high dormancy suggests that older coins are moving, which often happens near market tops as long-term holders take profits. Low dormancy indicates newer coins are moving, which is typical during accumulation phases. (See also: Stablecoin Chargebacks: Crypto’s Latest Innovation Embracing Traditional Finance)
Miner Outflows and Hash Rate
Miners are key players in the crypto ecosystem, and their behavior can offer unique insights. Miner outflows represent the amount of cryptocurrency miners are sending to exchanges or other wallets. A significant increase in miner outflows can indicate that miners are selling their rewards, potentially to cover operational costs or take profits, adding selling pressure to the market. Conversely, reduced outflows suggest they are holding, signaling a more bullish outlook.
The hash rate, a measure of the total computational power being used to mine a cryptocurrency, is a direct indicator of network security and miner confidence. A rising hash rate signifies a healthier, more secure network and increased miner participation, often viewed as a bullish long-term signal. A sustained drop, however, can point to issues with profitability or network stability.
Integrating On-Chain Data into Your Investment Strategy
The power of on-chain metrics isn’t in looking at a single data point in isolation, but rather in synthesizing multiple indicators to form a holistic view. Think of it as putting together pieces of a complex puzzle.
- Identify Accumulation Zones: Look for low MVRV ratios, high exchange outflows, increasing active addresses, and LTH accumulation. These signal strong potential bottoms.
- Spot Distribution Phases: Watch for high MVRV ratios, significant exchange inflows, increasing coin dormancy, and LTH distribution. These often precede market corrections.
- Assess Network Health: Consistent growth in active addresses, transaction count, and hash rate confirms a project’s fundamental strength and adoption.
- Manage Risk: Use these metrics as a probabilistic tool, not a crystal ball. They provide context and probabilities, helping you size positions and set realistic expectations for your portfolio.
From my vantage point analyzing emerging markets, the granular data available on-chain offers a paradigm shift in how we approach asset valuation. It’s a tool that empowers individual investors with the same level of fundamental insight often reserved for institutional players in traditional markets. We’re moving beyond speculation, towards a data-driven understanding of digital assets. While the crypto market is inherently volatile, leveraging these metrics allows you to cut through the noise and make more informed, strategic decisions. Don’t just react to price; understand the underlying forces that drive it.
Embrace the transparency of the blockchain. Start tracking these crucial on-chain metrics today, and transform your approach to crypto investing from guesswork to guided insight. Your portfolio will thank you for it.
❓ Frequently Asked Questions
What are on-chain metrics in cryptocurrency?
On-chain metrics are data points directly recorded and verifiable on a public blockchain ledger. They provide insights into network activity, user behavior, transaction volumes, and investor sentiment by analyzing transactions, addresses, and other public data.
How do on-chain metrics differ from technical analysis?
Technical analysis primarily uses price charts and trading volumes to identify patterns and predict future price movements based on historical data. On-chain metrics, conversely, analyze fundamental network activity and user behavior directly from the blockchain, offering insights into the underlying supply and demand dynamics, rather than just price action.
Which on-chain metrics are most important for beginners?
For beginners, focusing on active addresses, transaction volume, and exchange net flows (inflows vs. outflows) provides a good foundation. These metrics offer clear indicators of network adoption, usage, and immediate buying/selling pressure, which are relatively easy to understand and track.
Where can I find reliable on-chain data?
Several platforms specialize in on-chain data analysis. Popular sources include Glassnode, CryptoQuant, CoinMetrics, and Nansen. Many of these platforms offer free basic data points, with more advanced metrics available through paid subscriptions.
Can on-chain metrics predict future crypto prices?
While on-chain metrics are powerful tools for understanding market conditions and investor behavior, they do not offer guaranteed price predictions. They provide a probabilistic framework for assessing potential market tops or bottoms, accumulation, or distribution phases, and overall network health, allowing investors to make more informed decisions rather than relying on speculation alone.




0 Comments