

Ever found yourself staring at a financial news ticker, seeing numbers flash for the S&P 500 or the Dow, and wondering what it all actually means for your money? You’re not alone. For many new to the world of investing, understanding how to read stock market indices can feel like decoding an ancient language. But it’s an essential skill, providing a crucial lens through which to view the broader financial landscape.
📋 Table of Contents
As someone who’s covered global markets since 2015, I’ve seen firsthand how these seemingly simple numbers tell complex stories about industries, economies, and even global events. They’re not just abstract figures; they are powerful barometers of market performance, reflecting the collective mood and activity across vast segments of the economy. This article will break down the basics, empowering you to move beyond mere observation to confident interpretation.
What Exactly Are Stock Market Indices, Anyway?
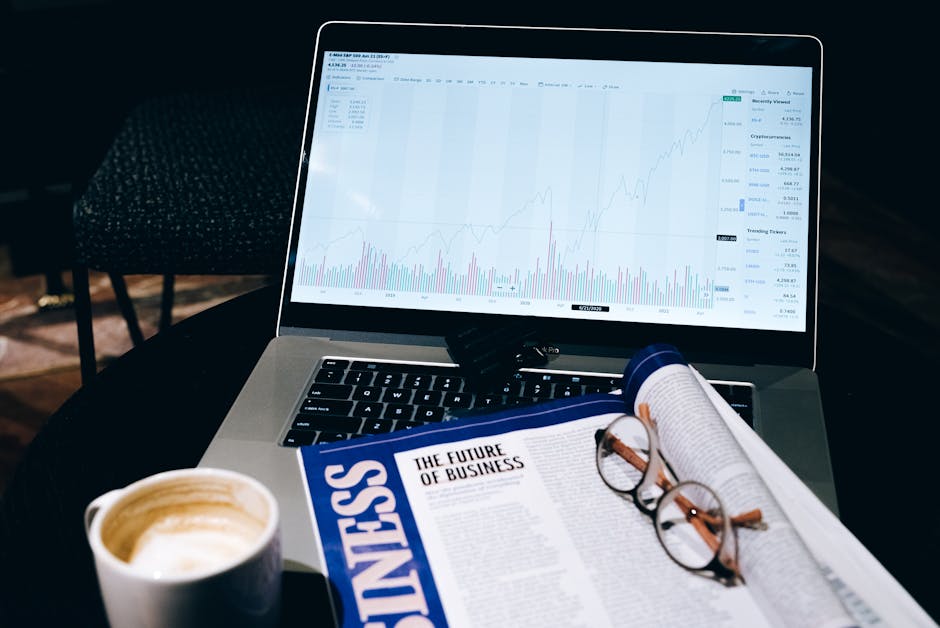
Before we dive into how to read stock market indices, let’s clarify what they are. Simply put, a stock market index is a measurement of a section of the stock market. It’s like a basket of stocks, chosen to represent a particular market, industry, or economic sector. Instead of tracking every single stock (there are thousands!), indices provide a manageable way to gauge overall trends and health. Think of it as taking the temperature of the market: a single reading gives you a general idea of its state.
These indices are typically weighted, meaning some stocks within the basket have a greater influence on the index’s value than others. This weighting can be based on price, but more commonly, it’s based on market capitalization – the total value of a company’s outstanding shares. This method ensures that larger, more influential companies have a more significant impact on the index’s movement, making it a more accurate reflection of the broader market.
The Major Players: S&P 500, Dow, Nasdaq
When you hear about ‘the market,’ chances are people are referring to one of these giants. In the U.S., three indices dominate the headlines:
- The S&P 500 (Standard & Poor’s 500): Widely considered the best single gauge of large-cap U.S. equities, it comprises 500 leading publicly traded companies chosen by a committee. It’s market-capitalization weighted, meaning companies like Apple and Microsoft have a significant sway.
- The Dow Jones Industrial Average (DJIA): Often simply called ‘the Dow,’ this is a price-weighted index of 30 significant companies traded on the Nasdaq and the New York Stock Exchange. While it only contains 30 stocks, they are typically industrial titans like Boeing, Coca-Cola, and Visa.
- The Nasdaq Composite: This index includes almost all stocks listed on the Nasdaq stock exchange, heavily featuring technology and growth companies such as Amazon, Tesla, and Google’s parent, Alphabet. It’s particularly sensitive to trends in the tech sector.
Each of these indices offers a slightly different perspective on the U.S. market. The S&P 500 gives you a broad view of large companies, the Dow focuses on established industrial giants, and the Nasdaq highlights the tech-driven growth sector. Understanding these distinctions is key to interpreting their daily movements.
Global View: FTSE, Nikkei, DAX, Hang Seng
Beyond U.S. borders, several other indices serve as critical indicators for global economic health:
- FTSE 100 (Financial Times Stock Exchange 100): Represents the 100 largest companies listed on the London Stock Exchange.
- Nikkei 225: Japan’s premier index, comprising 225 large, publicly owned companies.
- DAX 40 (Deutscher Aktienindex): Tracks the performance of the 40 largest and most liquid companies traded on the Frankfurt Stock Exchange.
- Hang Seng Index (HSI): The primary indicator of the Hong Kong stock market’s performance.
Tracking these global indices helps you understand how different regional economies are performing and how interconnected global markets truly are. For instance, a sharp drop in the DAX might signal concerns about European manufacturing, while a surge in the Hang Seng could indicate renewed optimism in Asian markets. They provide context for your own investments, especially if you hold international funds or stocks.
Understanding the Numbers: How to Read Stock Market Indices Effectively
When you see an index reported, you’ll typically see its current value, the change in points, and the percentage change for the day. For example, ‘S&P 500 up 50 points (1.2%)’. The actual point value (e.g., 5,000 for the S&P 500) isn’t as important as its daily or historical percentage change. A 1% rise in the S&P 500 means the collective value of those 500 companies, weighted by their market cap, has increased by that much.
What truly matters for beginners is the direction and magnitude of the change. Is the index up or down? By how much? And over what period? A small daily fluctuation is normal market noise, but consistent movements over weeks or months can signal significant trends. This is where understanding how to read stock market indices goes beyond just checking the daily numbers.
Price-Weighted vs. Market-Cap Weighted
As mentioned, how an index is weighted significantly impacts its behavior. The Dow Jones Industrial Average is price-weighted, meaning stocks with higher share prices have a greater impact on the index’s movement, regardless of the company’s overall size. For instance, if a company with a $300 share price moves by $1, it has a larger effect on the Dow than a company with a $100 share price moving by $1, even if the latter is a much larger company by market value.
Most modern indices, like the S&P 500 and Nasdaq Composite, are market-capitalization weighted. This means companies with larger market caps (share price multiplied by the number of shares outstanding) have a proportionally larger influence. This method is generally considered to be a more accurate representation of the overall market because it reflects the true economic size of the companies within the index. Understanding this difference helps you interpret why one index might move differently than another on a given day.
Interpreting Daily Movements and Trends
A single day’s movement in an index is just a snapshot. While exciting or alarming, it rarely tells the whole story. What’s more important is to look for trends over time. Is the index consistently moving higher over weeks or months, indicating a bull market? Or is it steadily declining, suggesting a bear market or a correction?
“The stock market is a device for transferring money from the impatient to the patient.” — Warren Buffett
Historical data is your friend here. Websites like Yahoo Finance or Google Finance allow you to view charts showing index performance over various periods – one month, six months, one year, five years, or even max historical data. Observing these longer-term patterns provides much better context for current movements. For example, a 2% drop today might seem significant, but if the index has gained 15% over the past year, it’s a minor blip within a strong uptrend.
Volume and Volatility: Beyond the Price
Beyond just the price movement, pay attention to trading volume and volatility indicators. Trading volume tells you how many shares of the underlying stocks in an index were traded. High volume on a significant price move (up or down) suggests strong conviction behind that move. Low volume might indicate less significance. (See also: Mastering Technical Analysis Basics: Candlesticks, RSI, and MACD)
Volatility refers to the degree of variation of a trading price series over time. High volatility means prices are swinging wildly, which often accompanies periods of uncertainty or major news. The VIX (CBOE Volatility Index), often called the ‘fear gauge,’ measures expected volatility in the S&P 500. A rising VIX often correlates with falling stock prices, as investors become more apprehensive. Recognizing these additional layers helps you build a more nuanced understanding of market dynamics.
Why Stock Market Indices Matter for Your Investments
For beginner investors, indices are more than just news headlines; they are fundamental tools. They provide context, help you evaluate your own portfolio, and offer insights into the broader economic landscape. You don’t need to be a professional trader to benefit from understanding these indicators.
Indices give you a quick, at-a-glance understanding of how the overall market is doing. If the S&P 500 is up 1.5% today, it suggests a generally positive day for large U.S. companies. If it’s down 2%, it points to widespread selling pressure. This general sentiment is invaluable, especially when you’re trying to make sense of individual stock movements or gauge the overall investment climate.
Gauging Overall Market Performance
Indices are the ultimate yardstick for market performance. They represent the collective wisdom (and sometimes panic) of millions of investors. A consistently rising index suggests a growing economy, corporate profitability, and investor optimism. Conversely, a sustained decline can signal economic headwinds or a loss of confidence. For example, during the dot-com bubble burst in the early 2000s, the Nasdaq Composite plunged over 75% from its peak, dramatically reflecting the collapse of speculative tech stocks.
By watching these movements, you gain a sense of the prevailing winds. This doesn’t mean you should react to every gust, but it helps you understand the environment your investments are operating within. If your portfolio is primarily U.S. large-cap stocks, comparing its performance against the S&P 500 is a natural and useful exercise.
A Tool for Portfolio Diversification
Understanding different indices can guide your portfolio diversification efforts. If you notice that the Nasdaq is soaring while the FTSE 100 is lagging, it might prompt you to consider if your portfolio has too much exposure to one sector or geography. Indices help you visualize how different segments of the market are performing relative to each other.
For instance, an investor heavily invested in U.S. tech stocks might look at the DAX or Nikkei to see how European or Asian markets are faring. If those markets are strong, it might be a signal to explore international ETFs or mutual funds to broaden their exposure and reduce reliance on a single market. This strategic use of indices can significantly enhance the resilience of your portfolio.
Reflecting Economic Health and Investor Sentiment
Stock market indices are often considered leading economic indicators, meaning they tend to predict future economic activity. A strong, rising market can signal expectations of future economic growth and increased corporate earnings. Conversely, a declining market can suggest an impending slowdown or recession.
They also serve as a powerful gauge of investor sentiment. When indices are breaking new highs, it often reflects widespread optimism and confidence. When they tumble, it usually points to fear and uncertainty. While you shouldn’t base all your decisions on sentiment, understanding the prevailing mood can help you contextualize market reactions to news events, from inflation reports to geopolitical tensions. Remember, markets are often driven by emotion in the short term, even if fundamentals prevail in the long run. (See also: Pokémon Trading Card Hop’s Zacian EX Box: A Market Bellwether?)
Practical Tips for Beginner Investors Using Indices
As you learn how to read stock market indices, it’s crucial to adopt a balanced perspective. They are powerful tools, but like any tool, they must be used correctly. Here are some actionable tips for incorporating index analysis into your beginner investor journey.
Don’t Obsess Over Daily Swings
The biggest mistake a beginner can make is to check the market every hour, or even every day, and react emotionally to every fluctuation. Daily movements are often noise – driven by short-term trading, news cycles, and algorithms. For long-term investors, these daily swings are largely irrelevant. Focus on the bigger picture and your long-term financial goals.
Think of it this way: if you’re saving for retirement 20 or 30 years from now, whether the S&P 500 is up or down 0.5% today has almost no bearing on your eventual outcome. Patience and a steady hand are far more valuable than a quick trigger finger in investing.
Look at the Bigger Picture and Historical Data
Instead of focusing on daily changes, examine index performance over months, quarters, and years. This provides true insights into trends. The S&P 500, for example, has historically delivered an average annual return of around 10-12% over many decades, despite numerous recessions, crises, and market corrections. This long-term perspective is vital.
Use charts that allow you to zoom out. Look at how indices behaved during major historical events like the 2008 financial crisis, the dot-com bubble, or even the COVID-19 pandemic. Understanding these historical patterns gives you a sense of what to expect and helps you prepare for inevitable market cycles. This informed view is critical to avoiding panic selling during downturns.
Use Indices as a Benchmark, Not a Crystal Ball
Think of indices as a benchmark against which you can measure your own investment performance. If you hold a diversified portfolio of U.S. large-cap stocks, how does its return compare to the S&P 500? If your portfolio consistently underperforms a relevant index over a long period, it might be time to reassess your investment strategy or asset allocation.
However, an index is not a crystal ball. It doesn’t predict the future. While it reflects current investor expectations and past performance, it cannot tell you exactly what will happen tomorrow. Relying on indices for short-term trading signals is a risky endeavor for beginners. Instead, use them to understand broader trends and to ensure your own investments are on track with your long-term objectives.
Mastering how to read stock market indices is a foundational step for any beginner investor looking to navigate the complexities of global markets. They are more than just numbers; they are powerful narratives about economic activity, corporate health, and human psychology. My years covering these markets have taught me that while the daily fluctuations grab headlines, the true story is in the long-term trends and the underlying economic currents they represent. For anyone starting out, cultivating this broader perspective will save you a lot of anxiety and help you make more informed decisions.
By understanding what indices are, how they’re constructed, and what factors influence their movements, you gain a significant advantage. This knowledge will not only help you interpret financial news with greater confidence but also empower you to make more strategic decisions for your own portfolio diversification and long-term financial growth. So, keep learning, stay curious, and let these market barometers guide your journey.




0 Comments